Introduction
There has been some discussion and misunderstanding around the low frequency of draws in football on my Twitter feed recently so I thought I'd just give a quick recap around why the probabilities of draws are so low.
The Bookmakers
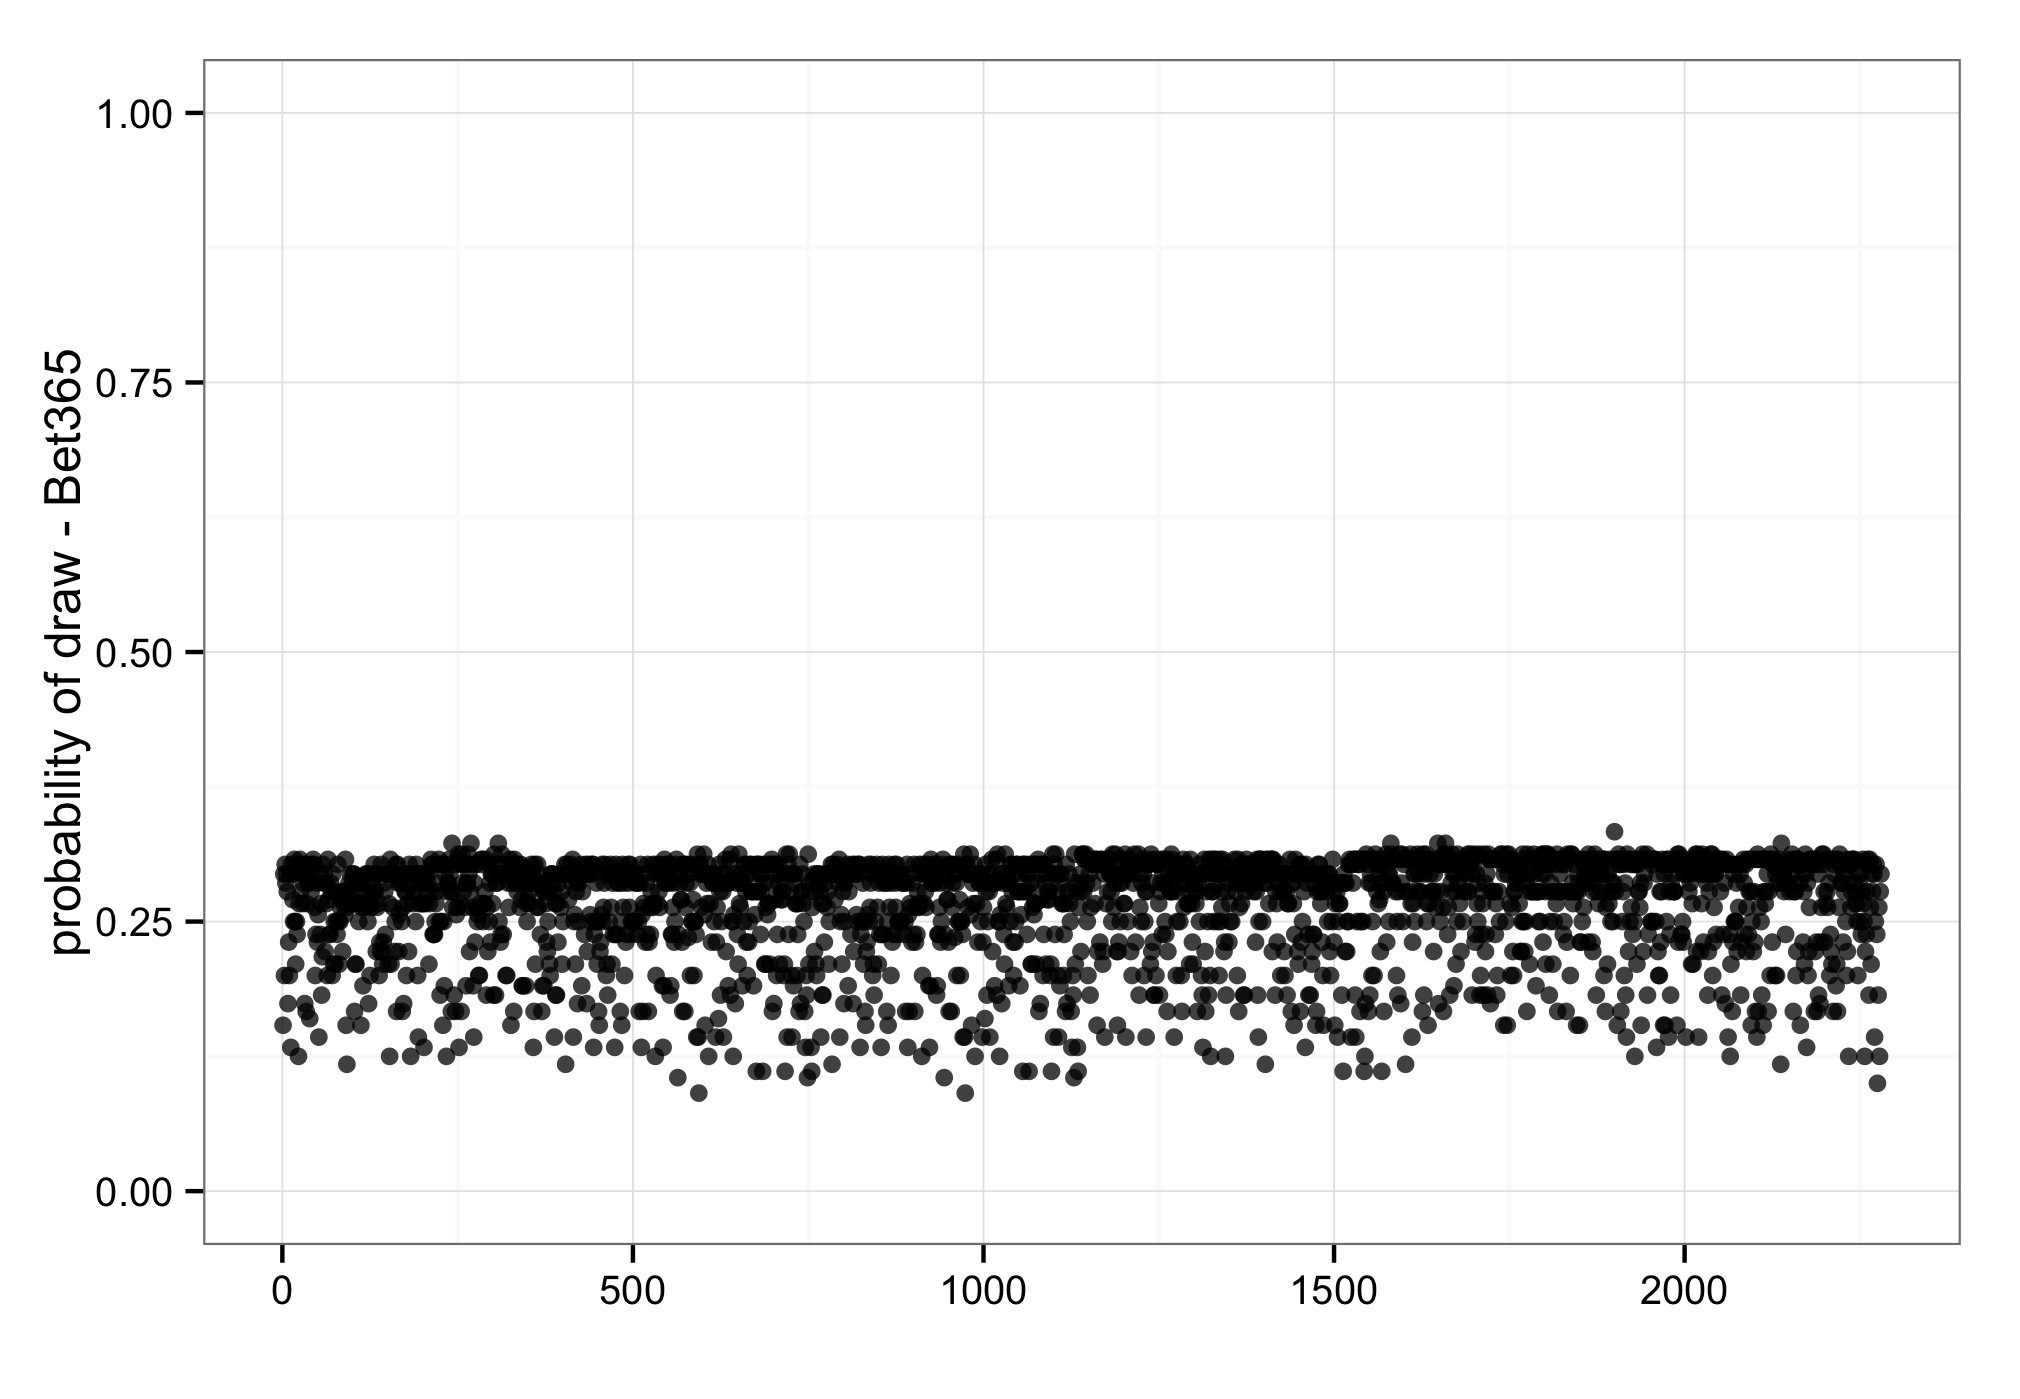
Just to give you an idea around how infrequently draws occur in football, the figure below shows Bet365's odds of a draw for all English Premier League matches going back to the 2009/2010 season. The maximum probability they gave during this time was 33.3%, the minimum was 9.1% and the mean was 26.1% with a standard deviation of 4.1%. You can actually see that 33.3% value as it's so rare it stands out from all the other points on the chart. In fact, since 2009/2010 only eight matches have even gone above 31%.
Why So Low?
Bet365's odds of a draw occurring are really narrow at 26.1% ± 4.1%. Is this range really plausible?
Well, first of all let's start off by making the assumption that the betting industry know what they are doing and that their odds are reflective of what actually happens in football. Presuming this narrow range of draw probabilities is correct, let's work through some examples and find out why they are so low.
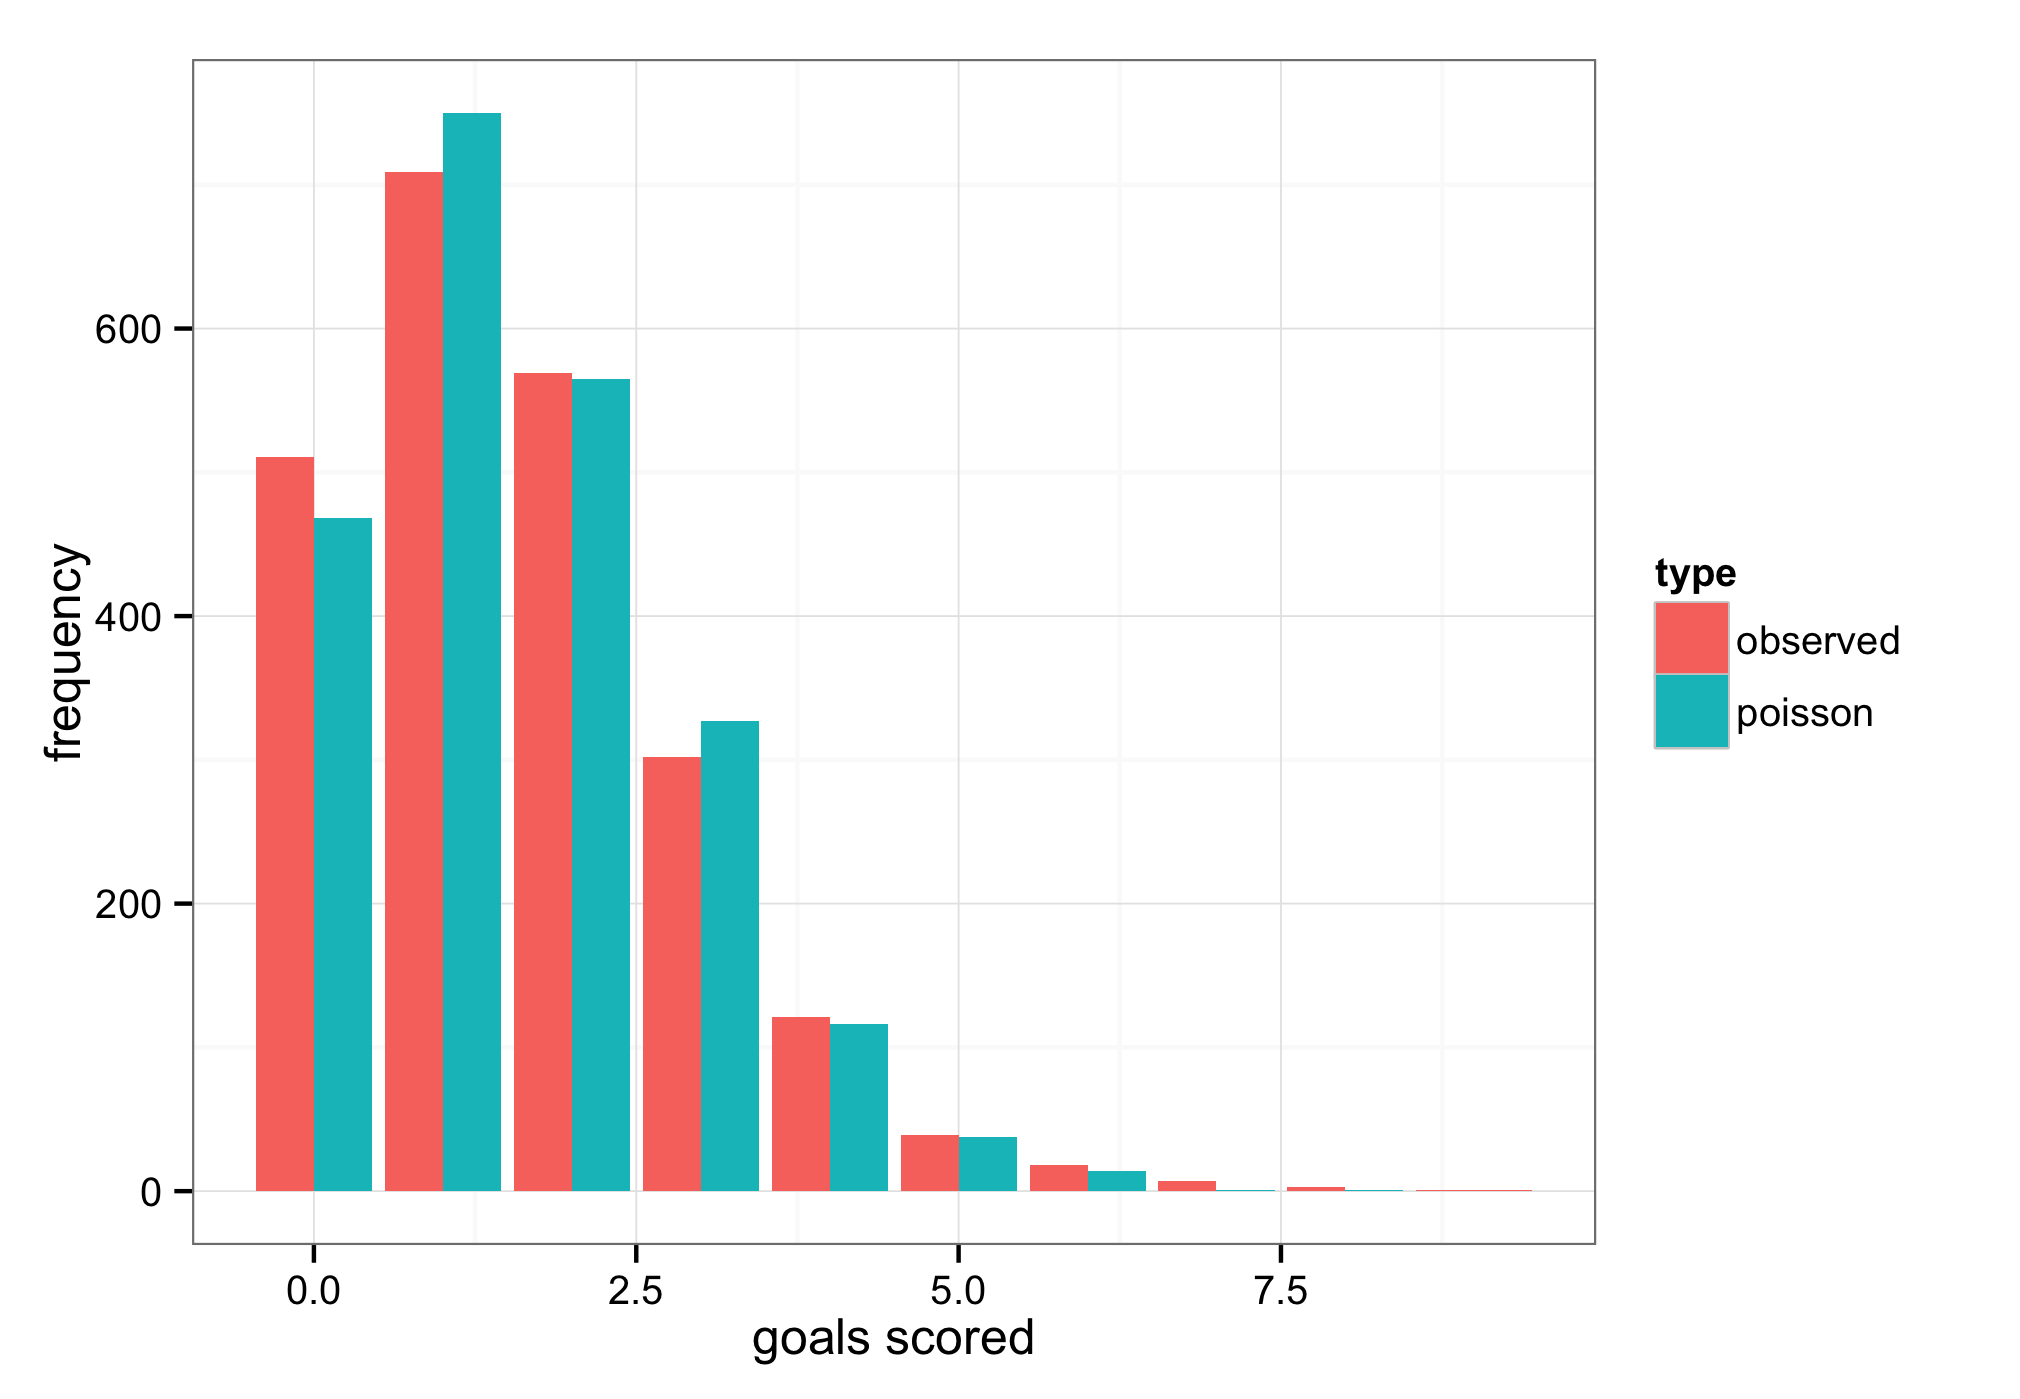
Goals scored in football matches pretty much follow a Poisson distribution as shown in the figure below. Sure, it's not perfect, but as you can see it's very close and the bits where it doesn't quite match up can be accounted for in our calculations later on.
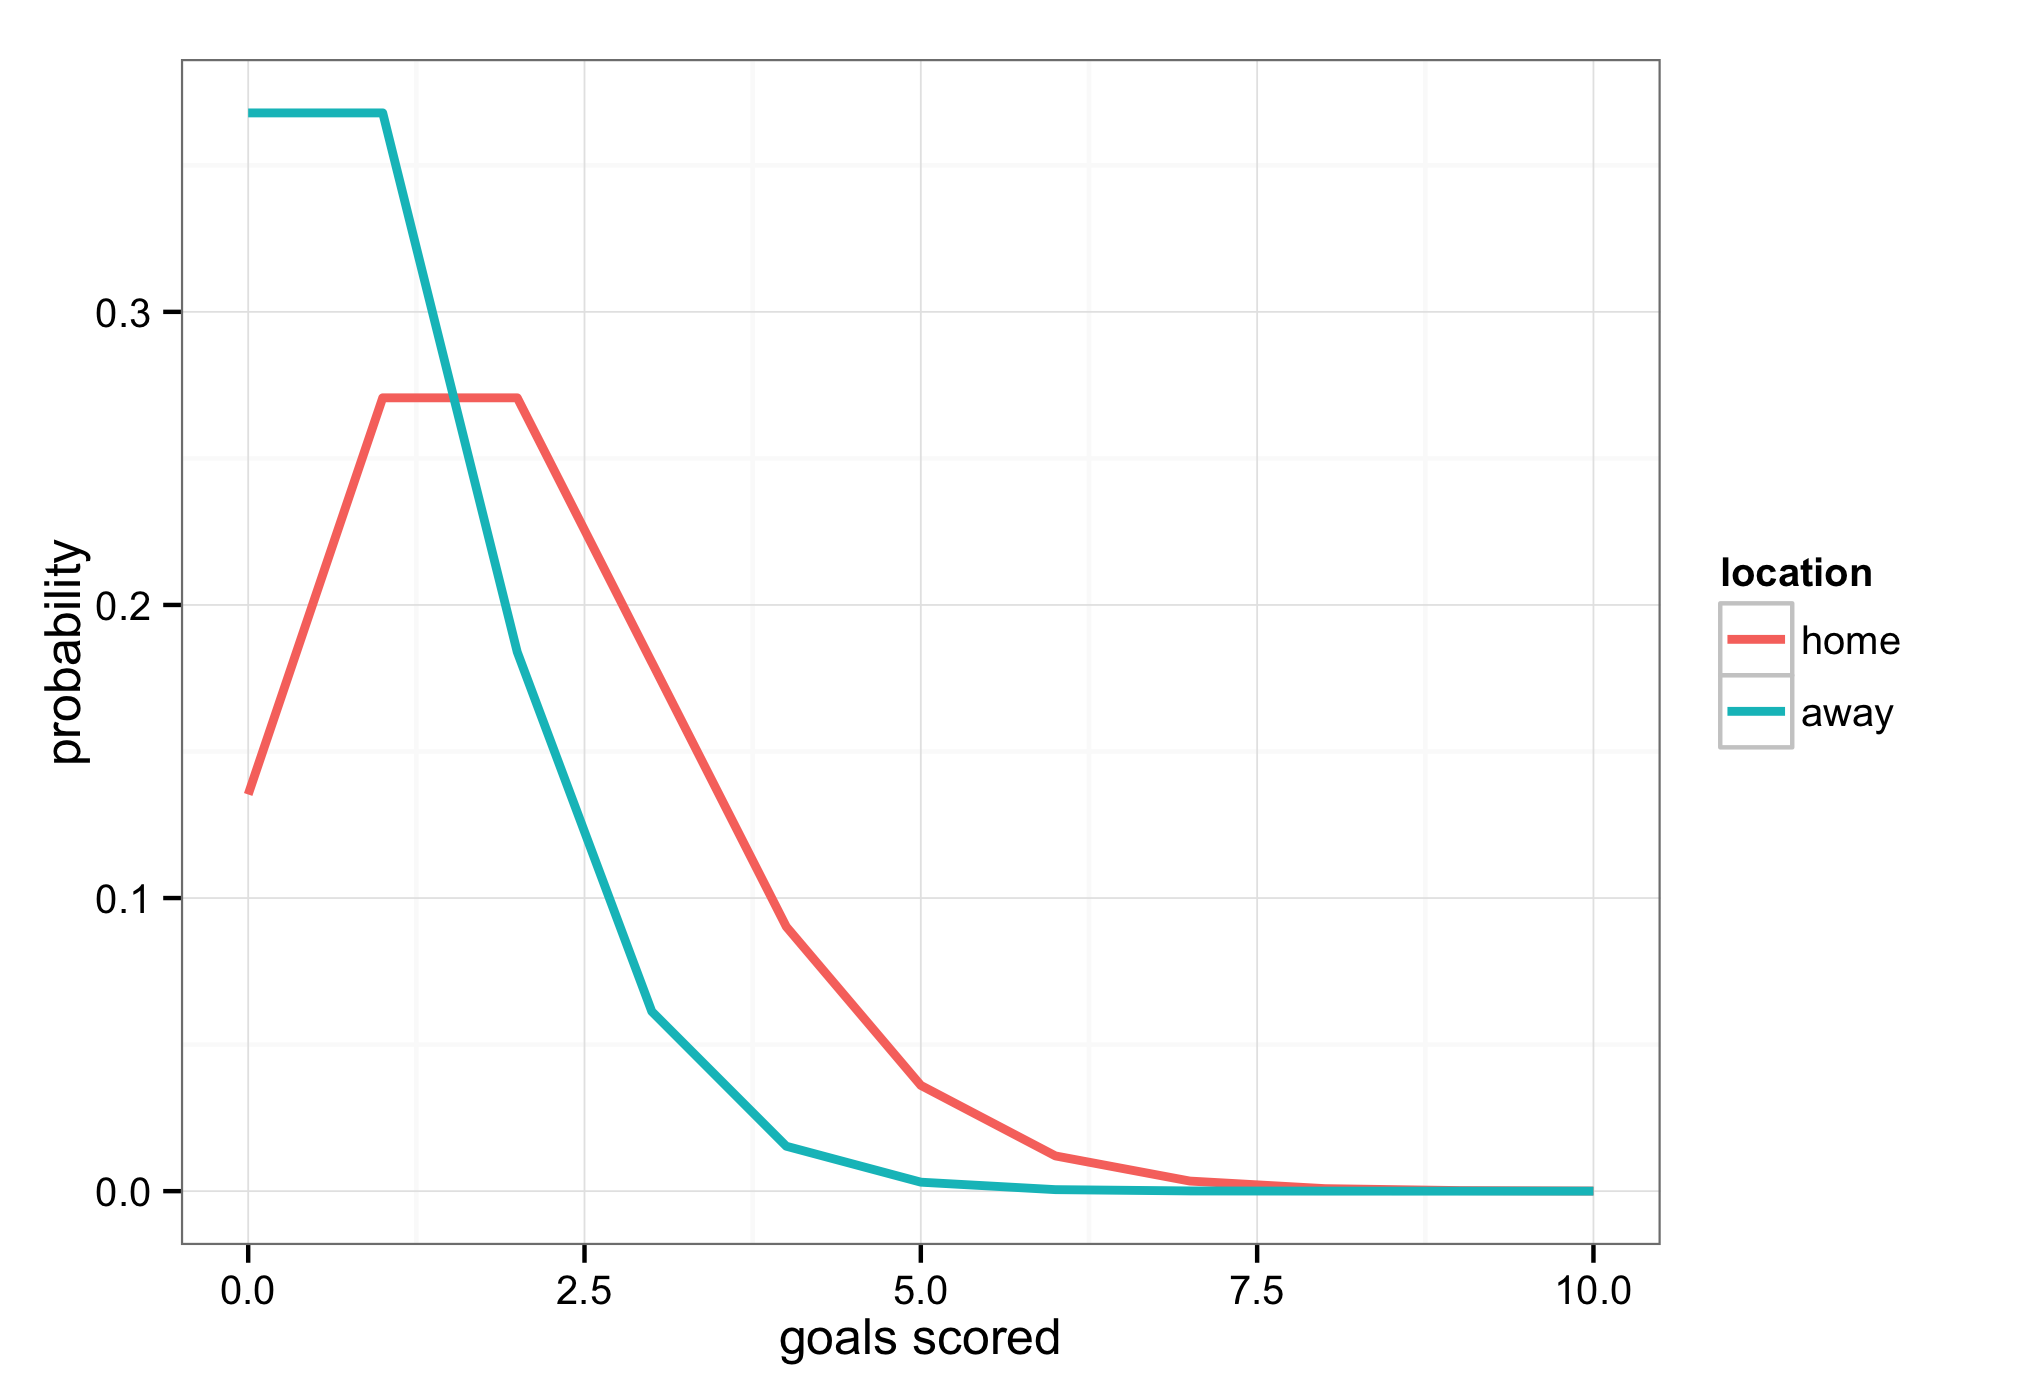
Since we know the probability distribution that describes goal scoring it's actually fairly trivial to calculate the probability of a team scoring 0, 1, 2, 3 goals etc based on how many goals they score on average. For example, the figure below shows the probabilities for each goal from 0-10 for a match where the home team scores two goals on average and the away team scores one goal on average.
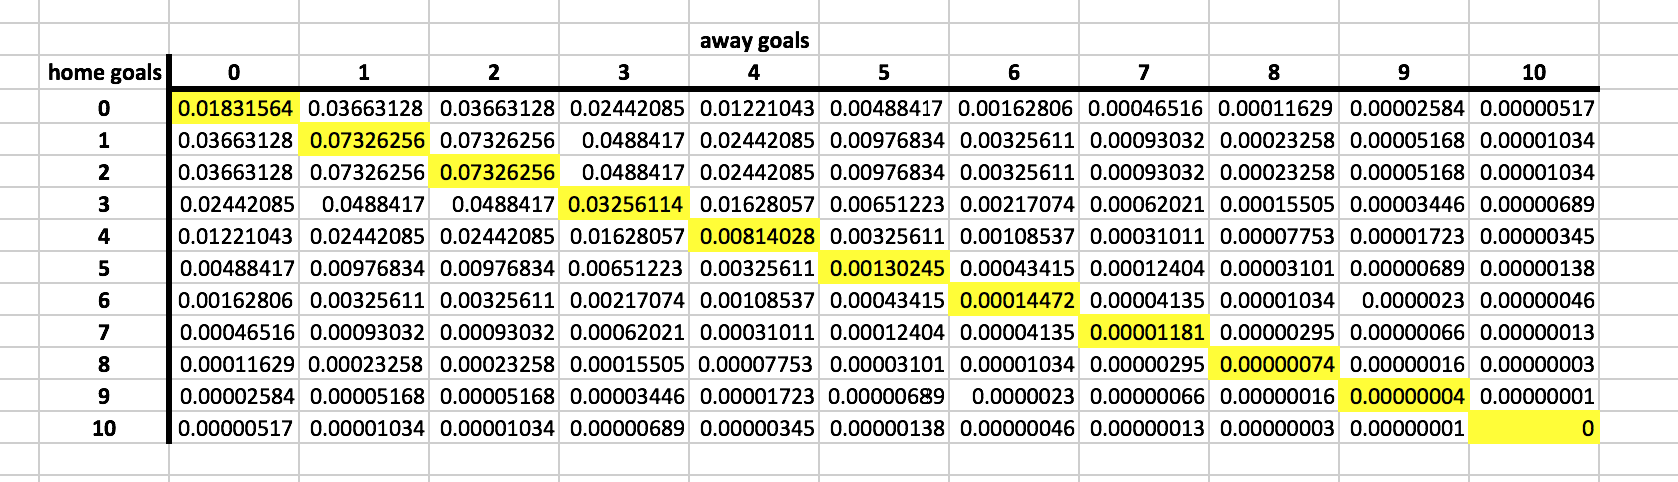
And since we now know the probabilities of how many goals each team will score, we can calculate the probabilities of each individual score line that could feasibly happen and put it into a table as shown in the figure below.
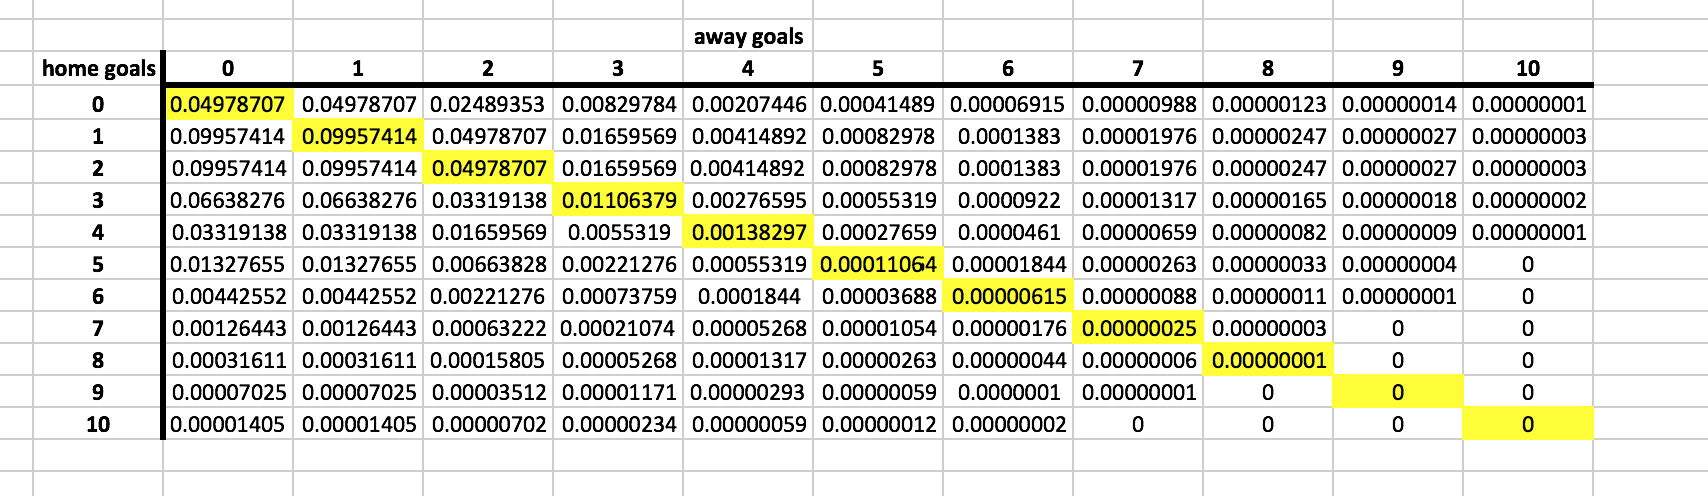
To find out the probability of a draw, we can then sum up the probabilities of all the tied score lines (which I've highlighted in yellow for clarity) giving us a 21.1% chance of a draw, rising to 24.7% once we account for football's divergence from the true Poisson distribution.
This is pretty close to Bet365's average but still seems low overall so let's do the same again but for two identical teams both expected to score two goals each. Surely the chances of a draw will increase massively right?
Actually no, even with two identical teams the draw probability is still only around 25%, with home and away win probabilities of 37.5% each. Yes, even for two identical teams the least likely outcome is still the draw.
Think about it, of all the possible score lines that could happen in a match comparatively few lead to ties - there are much more score lines that result in a home or away win so the probability of a draw is always low and a draw will never be the most likely outcome because of this.
The chance of a draw does increase though for teams that score fewer goals as there is greater potential for both teams to fail to score, resulting in more nil-nils. If we change the example above from teams averaging two goals each to one goal each then the draw percentage increases from 25% to nearer 30%.
There is a limit to how low scoring even the worst teams are though, which is why there is a natural limit on how high the bookmakers draw probabilities will ever reach and why it's extremely rare you'll ever see anything above Bet365's previous maximum of 33.3%.
Conclusions
Football is difficult to forecast accurately and draws can provide a quick way to sense check a model's feasibility - if you are seeing draw probabilities regularly breaking the 31% barrier then your model's accuracy is likely very poor and does not accurately reflect the true chances of seeing a draw. Plus, if your draw probabilities are inaccurate then your home / away win probabilities must be inaccurate too...
Be very wary of high draw probabilities!