Blog List.

Expected Goals: Foot Shots Versus Headers

Introduction

My last article on expected goals introduced the concept of using exponential decay to estimate the probability of scoring based on the shooter’s distance from the goal. The article received lots of feedback (thanks everyone!!), with a couple of common comments standing out that I wanted to address.

Simplifying The Model

One common theme was whether the model was at risk of over-fitting and this is certainly something I was concerned about myself. In fact, I have since simplified the model to the equation below to help minimise this risk:

$expg=exp(-distance/a)$

Figure 1: Simplified Expected Goals Equation

As well as reducing the complexity of the model and making it easier to calculate the expected goals, the new equation has fewer parameters so the potential for overfitting is lower. The correlation between actual / expected goals has fallen slightly from 0.98 to 0.97 but the advantages of the simpler equation far outweigh such a minimal change.

Headers Versus Foot Shots

Another common question was whether it was important to split out headers and foot shots into separate models as the previous articles have so far ignored headers due to lack of data.

To investigate this I have been busy all summer collecting more shot data. I’m up to 45,000 shots in total now, including around 7,500 headers so I’m at the point where I’m happy to start the preliminary work comparing foot / headed shots although I certainly want more headers before drawing any definite conclusions.

I’ve run through all the curve fitting again for both headers and foot shots and plotted the resulting probability curves in Figure Two below.

Pelican

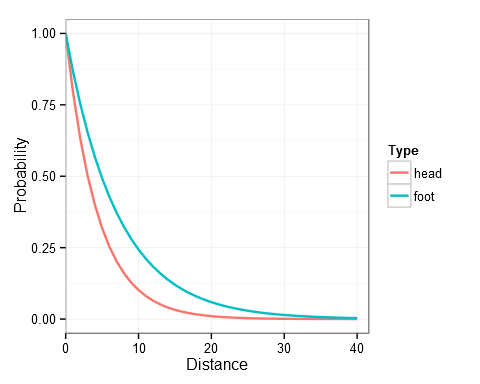
Figure 2: Expected Goals: Shots Versus Headers

As you can see, headers have a noticeably lower chance of leading to a goal. The gap between head and foot shots appears largest around the ten metre mark, where foot shots have pretty much twice the probability of scoring. By 22 metres the chance of scoring from a header is virtually zero, while foot shots don’t reach this level until around 40 metres out.

Conclusions

But is this difference significant and do we actually need to bother creating separate expected goals models for headers and foot shots?

Well, if we compare the two probability curves against each other then the p value comes out at 0.064. Typically we take p values of 0.05 or lower to signify significance so by that count there is no real difference between the two.

However, p values should never be about some absolute cut off where <= 0.05 equals significance and everything else can just be ignored.

Having a value close to significance is suggestive that there may be a real difference there, especially when there is still a limited data size for headers so it’s certainly possible that headers and foot shots will warrant separate models. Luckily with the current equation this is really simple to do as we just need to alter the value of a as shown below in the appendix. This is an area I’ll be exploring in more detail as I add more headers to my database.

Appendix: Using the Expected Goals Model

To use the expected goals model you just need two numbers:

x = distance from goal in metres along x axis

y = distance from centre of goal in metres along y axis

These can then be used to calculate the total distance the shot is taken from:

$distance=sqrt(x^2+y^2)$

The expected goals for the shot is then just:

$expected goals=exp(-distance/a)$

where a = 4.4 for headers and 7.1 for foot shots

Example

Here’s an example for a player taking a header from the penalty spot.

x = 11 as penalty spots are roughly 11 metres from the goals (equal to 12 yards)

y = 0 as penalty spots should be level with the centre of the goal

$distance=sqrt(11^2+0^2)=11$

$expected goals=exp(-11/4.4)=0.08$

So on average, a header from the penalty spot would be worth around 0.08 goals.

Easy, just don’t forget you need to use negative distance inside the exponential!

Comments

Antony Lee - September 1, 2014

think the model fitted is much better now, as the previous one with a constant implied that there was a non-zero probability of scoring from 100m!

did you manage yet, as you now have 45000 data points, to check the stationarity in the underlying process by comparing season-on-season fitting parameters?

Martin Eastwood - September 2, 2014

Thanks, I’ll be taking a look at that soon!

Matthew Langston - September 4, 2014

Do you use any particular software or program to calculate the xy co-ordinates from the Squawka stats page?

Martin Eastwood - September 4, 2014

All the processing of the data and model fitting etc was done using R and SQL

OI - September 5, 2014

Firstly, thank you very much for continuously sharing your model to the readers. This is particularly valuable for other bloggers like me, and I’ll probably publish some Expg results on my German blog linked above (if you permit).

Secondly, I think that the separation of headers is a very large step forward. I have to repeat my thanks. As you’ve examined yourself, there is a (nearly) significant difference between headers and foot shots on the long term, and certainly the difference is even more significant in smaller sample sizes (for single chances). Having tried out the older version, I had the feeling that the ExpG values are generally too low. The results from the new formula fit my subjective impressions much better.

Thirdly, I still see a possibility to improve your model (although this might sound a bit ridiculous with R2=0.97). In my opinion, the angle is a bit underrepresented. I know you include “dy”, but imagine a foot shot from dx=1 and dy=6.5. The total distance is 6.58 and the ExpG value 0.396. The angle to the middle of the goal of 9° is very sharp. I can’t imagine that players really convert this chance in 39.6 of 100 tries. As R2=0.97 for distance alone proves, the overall difference might not be so big, but similar to head/feet there can be a big difference for a single chance.

What about the angle of view (see here: http://blog.kickdex.com/post/52303980749/angle-of-view)? The angle of view for the example shot is 14°, whereas it is 36,7° for a shot from the penalty spot (distance: 6,58m vs. 11m, angle of view 14° vs. 36,7°!). I deduced a formula to compute the angle of view from dy and dx. Unfortunately, it is clearly more complicated than the simple Pythagoras, and I don’t know how to paste a screenshot of it in the comment section. The mathematical text by itself would be unreadable. Are you interested in the angle of view? If yes, we should find a possibility to share the formula, if not, I’d completely understand that you prefer simplicity, especially with the simple version being very accurate (I mainly ask because I myself want to know if the angle of view is more accurate than distance alone ;).)

Martin Eastwood - September 5, 2014

Thanks for the message, yes you are welcome to use the ExpG results on your blog but I would appreciate it if you acknowledge me and provide a link back to my site :)

Also, thanks for the link about the angle of view, I have not seen that before and it certainly looks interesting. I’ll add it to my todo list to investigate further when I get some free time and will let you know how I get on!

Jamie - September 7, 2014

I don’t know how you collected the data (from squawka?) but it can see how it might be possible to extract the location & result of each shot from squawka. I can’t see how to distinguish between shots & headers though.

Did you have to collect them separately or where you able to filter the data later and do you have any suggestions for collecting such data?

Also, I don’t know how much you use/keep track of your fixture predictions but there seems to be some ‘errors’. For example: Metz v Nantes has Predicted Goals = 0.001 & 0.000 respectively.

It is a shame you aren’t able to post more often.

Gareth Owen-Smith - November 12, 2014

Hi – really interesting methodology, thanks for sharing! I have had my own go at scraping shot data off squawka using selenium webdriver in python and trying to get a model based on both x-distance and y-distance, based on your approach (using R, which I’m happy to share, if you want?). I haven’t separated by foot shots or headers, but that should be easy enough to do later. My expected goals model based on x, y coordinates (in yards), is: xG = exp(-x/9.67)*exp(-y/11.0)

Martin Eastwood - November 12, 2014

Looks interesting Gareth! Definitely take a look at splitting out the headers / foot shots though as I expect you’ll see a difference in the model coefficients between the two.

Get In Touch!

Submit your comments below, and feel free to format them using MarkDown if you want. Comments typically take upto 24 hours to appear on the site and be answered so please be patient.

Thanks!

About

Pena.lt/y is a site dedicated to football analytics. You'll find lots of research, tutorials and examples on the blog and on GitHub.

Social Links

Get In Touch

You can contact pena.lt/y through the website here