A Mathematical Approach to Evaluating Footballers
With the 2017 Opta Pro Forum rapidly approaching, I thought it was about time I transcribed my presentation from the previous event discussing a mathematical model I’d been developing for rating and ranking footballers.
Introduction
An obvious starting point for developing a model like this was the plus / minus score you often see in American sports. This simply measures a team’s goal difference when a player is on the pitch compared with off it, where the greater the plus / minus score the better the player’s impact.
Whilst this may seem like a good idea, it’s unfortunately heavily biased towards the better teams. For example, take Sergio Agüero and put him in Stockport County’s first team and his plus / minus score would inevitably drop due to the quality of the players around him.
You can try and improve on this by moving to the adjusted plus / minus, which tries to account for the talent of the other players on the pitch. However, this doesn’t work well for football as the sport’s relative lack of substitutions doesn’t provide enough data to model all the combinations of players accurately enough and you end up with large errors that make the results meaningless.
Going Bayesian
An alternative approach is to use Bayesian Statistics, which allow you to incorporate prior beliefs into your mathematical model to help inform the predictions where there is a lack of data, such as for young players who haven’t played much before.
Imagine watching a footballer play for the first time - there’s a probability they may be the next Lionel Messi, there’s a probability they may be the next Bebé and there’s a probability they may be average and be somewhere between the two.
This is essentially how the model works. Based on all the available data for each player, the model constructs a set of Priors and uses them to estimate the player’s true talent compared with all the other footballers in the world. As the model gains more information about a player over the course of their career, the influence of these Priors diminishes and the credible intervals narrow around the player’s true talent level as the model gains more confidence in its predictions.
Talent Distribution
Figure One shows the distribution of player ratings in the English Premier League. To put these ratings into context they were calculated in February 2016 and at the lower end of the scale was Fabriccio Coloccini, a once decent footballer whose legs were rapidly failing him. In the middle was Ryan Mason who’s pretty much the epitome of averageness for the Premier League, and at the top end was Mesut Özil, one of the highest rated players to have ever graced the Premier League.
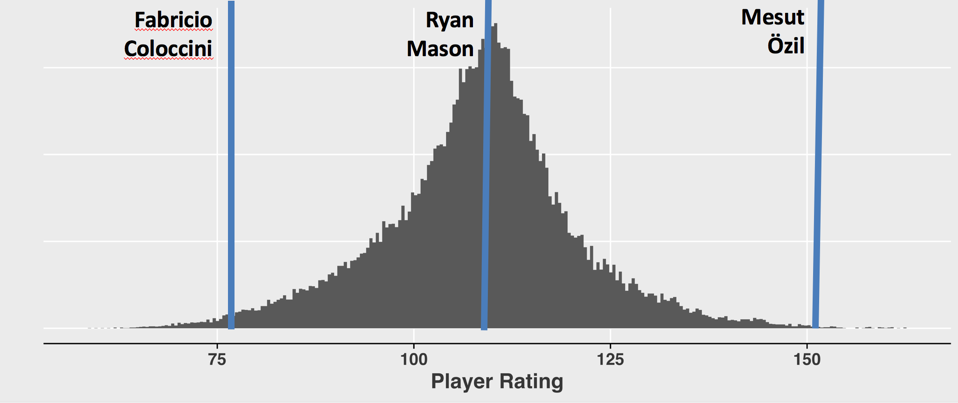 Figure One: Distribution of player ratings in the English Premier League
Player Career Trajectories
If you take these ratings and plot them out by age you can get an idea of what the average Premier League player’s career look like (Figure Two). Players start to break into the first team aged around 18, then steadily improve until the age of 25. They then plateau until around the age of 28, at which point the effects of age start to creep in and the player starts to decline before dropping out of the Premier League by the time they hit 35.
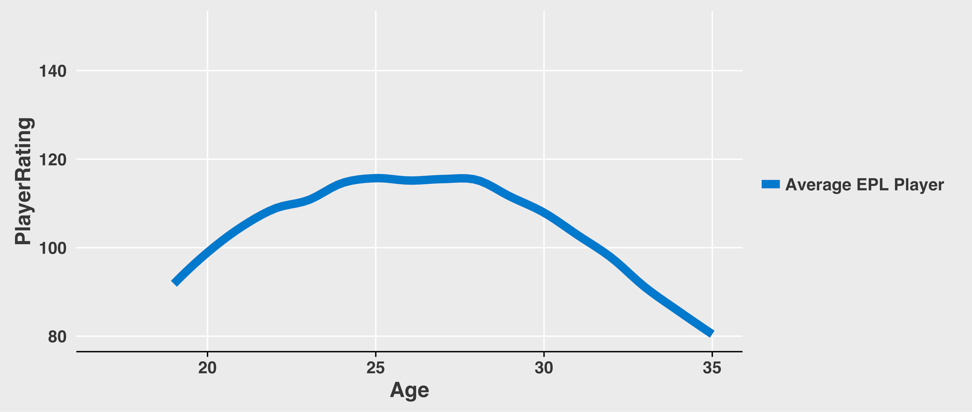 Figure Two: Average career of a Premier League Footballer
To put this into perspective, Figure Three shows Wayne Rooney’s career trajectory up until February 2016. The model rated Wayne Rooney as being massively superior to the average footballer from a very young age but it also suggests that he has been in serious decline since his mid-twenties and that he’s probably playing like a footballer five years older than he really is.
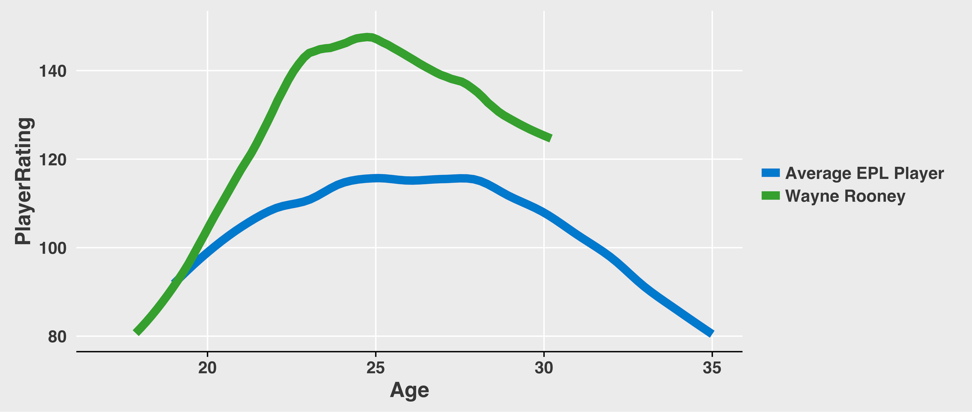 Figure Three: Wayne Rooney’s career trajectory
Figure Four below also shows the career trajectory for Micah Richards who signed for Aston Villa back in the summer of 2015. On the surface, it looked like a pretty good deal as Villa were getting an England international at his peak age for free. However, Richards’ profile shows that he has been in decline since the age of 25, and that by the time his four-year contract is up he’s likely to be a very average Championship defender at best.
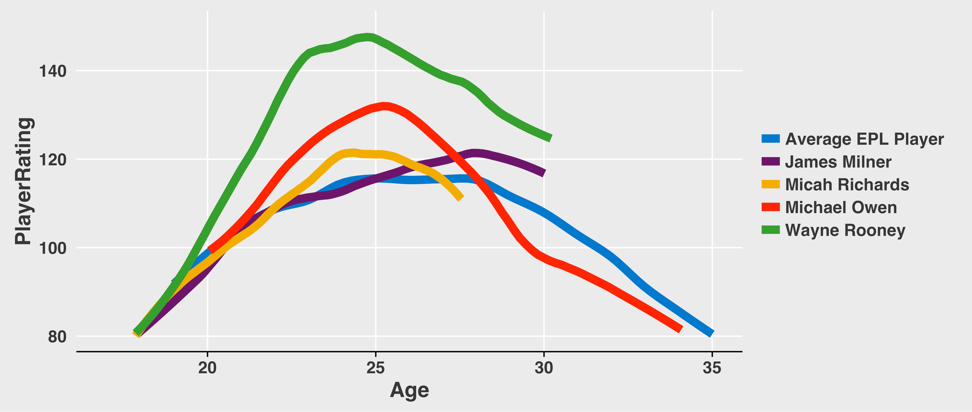 Figure Four: Career trajectories for Wayne Rooney, James Milner, Micah Richards, and Michael Owen
Validating the Model
Whenever I discuss this concept with people their first question is inevitably to ask who the top players in the world are, and at the time of writing the presentation for Opta back in February 2016 the results were:
- Lionel Messi
- Thomas Müller
- Cristiano Ronaldo
- Manuel Neuer
- Busquets
- Toni Kroos
- Neymar
- Robert Lewandowski
- Jordi Alba
- David Alaba
Admittedly, it doesn’t take a complex mathematical model to know that Lionel Messi is the greatest footballer in the world but it’s reassuring to see that the results look feasible, and it hopefully provides some confidence in the model’s utility. This is important because these types of ratings are highly subjective and difficult to validate as there’s no right or wrong answer - ask 100 football fans who the top players in the world are and you’re likely to get 100 slightly different answers.
False Negatives
The next step in terms of validating the model was to look at false negatives. If the model’s ratings were to be trusted, then you’d expect the best players in the world to have shown up as some of the best players in their age group when they were younger. If not, then the model is potentially missing something and ranking players lower than they should be.
To investigate this, I looked back at how the top players in the world were ranked on their 21st birthday compared with all the other players aged 21 or under at the time (Figure Five shows the top ten). Again, the results looked feasible with all the players ranked highly amongst their peers. The lowest ranked was Jordi Alba, who was playing at Gimnàstic de Tarragona in the Spanish 2nd tier at the time.
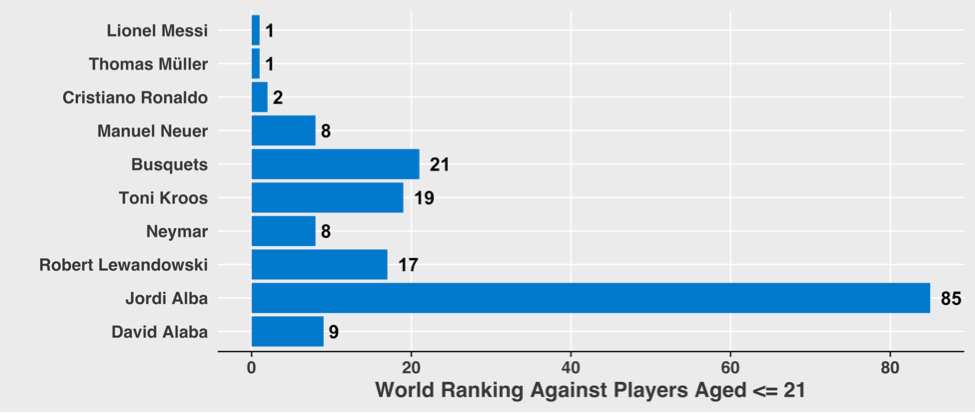 Figure Five: Rankings of the top ten players world-wide when aged 21
False Positives
We can also test the model by looking forwards in time to see whether youngsters rated highly tend to go on and have successful careers. As an example, Figure Six shows the rankings on the 1st February 2016 for the top ten ranked 21-year-olds on the 1st February 2010.
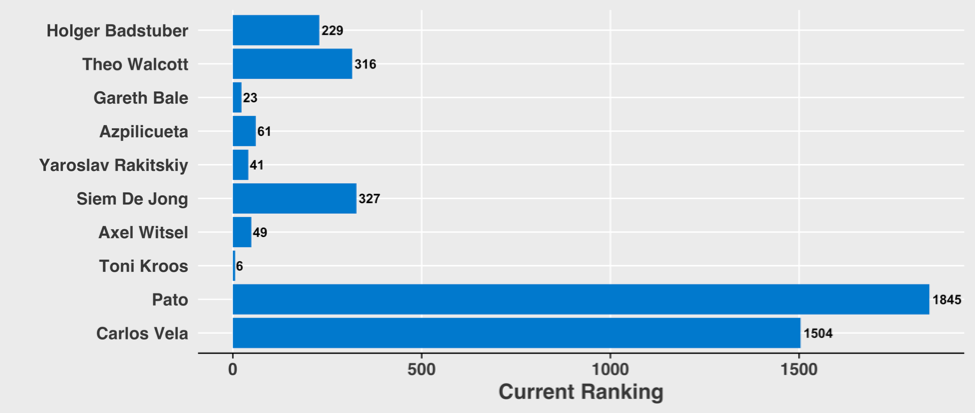 Figure Six: Rankings of the top ten 21-year-olds on the 1st February 2010
So back on the 1st February 2010, Holger Badstuber was ranked as the number one player worldwide aged 21 or under and by the 1st February 2016, he was ranked 229th best footballer in the world overall. To put this ranking into perspective, there are around 75,000 active players in the model’s database so it puts Badstuber in the top 1% of all footballers worldwide and in the top 10% of all footballers across the big five European leagues (England, Spain, Germany, Italy and France).
I’ve only shown a snapshot of data here as it’s not possible to display comparisons for all 75,000 players. However, for the current top 5,000 players in the world the average difference in rank at age 21 to now is around 150 places suggesting the model has decent predictive power for identifying which youngsters are likely to go on to have successful careers.
Player Ratings and Team Quality
These player ratings are also highly correlated to how well a team performs over the course of a season, where the higher a team’s average player ratings them the more points they are likely to achieve (Figure Seven).
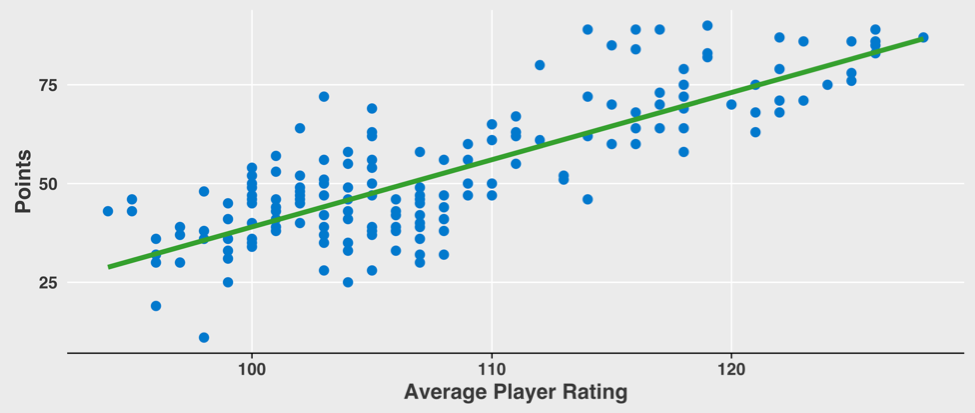 Figure Seven: Correlation between average team rating and points achieved per season
For those of you with a mathematical background, the r-squared value here is 0.77, meaning that 77% of the variability in the number of points a team achieves per season can be explained by the average rating of their players.
An interesting use of this is to predict the impact of injuries on a team’s expected points. For example, Sergio Agüero missed 12 matches of the 2015 / 2016 English Premier League due to injury and was predominantly replaced by Wilfried Bony. This reduced Manchester City’s average team rating by the equivalent of three points over the additional minutes played by Bony during Agüero’s injures.
You can also extend this idea to assess the value of potential transfers on your team. For example, if you are in the position to sign a new player who will increase your predicted points next season by two points then how much is that worth to you as a club in terms of transfer expenditure?
Player Ratings and League Position
A team’s average player rating also correlates with their final league position (Figure Eight).
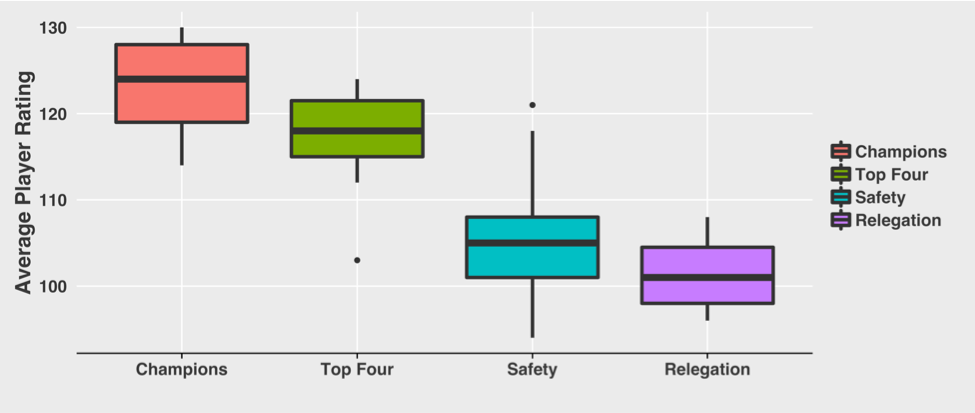 Figure Eight: Correlation between average team rating and league position
If you’ve not seen this type of chart before, it’s known as a Box and Whiskers plot. The thick black line across the centre of each box shows the average, the vertical lines show the most common range of values and the dots are outliers.
So, to finish first in the English Premier League your team needs an average player rating of 125, although the champions have ranged between 115 to 130.
To finish in the top four and reach the Champions League teams need an average rating of 118, although in 2011 / 2012 Tottenham managed fourth with a rating of 103.
To avoid relegation, teams need a rating of 105. The outlier here is Liverpool in 2009 / 2010 who managed to finish in seventh place despite having the second highest rated team that season, with players like Javier Mascherano, Fernando Torres and Steven Gerrard in their squad.
Finally, the teams that get relegated have average ratings of around 101, noticeably below the League’s average player rating of 108.
Interestingly though, there is a large overlap between the relegation and safety groups. This shows that the worst teams don’t always get relegated, perhaps due to reasons like bad luck, injuries or employing Tony Pulis…
Applications for Football Teams
I’m not advocating that teams should be signing players purely on the output of a mathematical model but using data like this can help football teams in many ways, such as identifying potential transfer targets, exploring player’s career trajectories and quantifying the potential impact of injuries.