Introduction
The use of Total Shot Ratio (or TSR) seems to have slowly been gaining ground so I thought it would be worth analyzing the statistic in more detail to see what it can and cannot do.
What is Total Shot Ratio?
Put simply Total Shot Ratio is the proportion of shots taken by one team compared with another. It can be calculated by dividing the number of shots taken by a team by the total shots overall (Figure 1).
$TSR=ShotsFor/(ShotsFor+ShotsAway)$
Figure 1: Total Shot Ratio
It is often used as a surrogate for dominance as the presumption is that the team taking the majority of the shots will be controlling the match and possibly limiting the opposition’s ability to shoot at goal.
Total Shot Ratio Data
Using data taken from the football-data.co.uk website I calculated the Total Shot Ratios for all matches from the English Premier League going back to the 2001-2002 season, giving a total of 8360 data points, which are normally distributed (Figure 2).
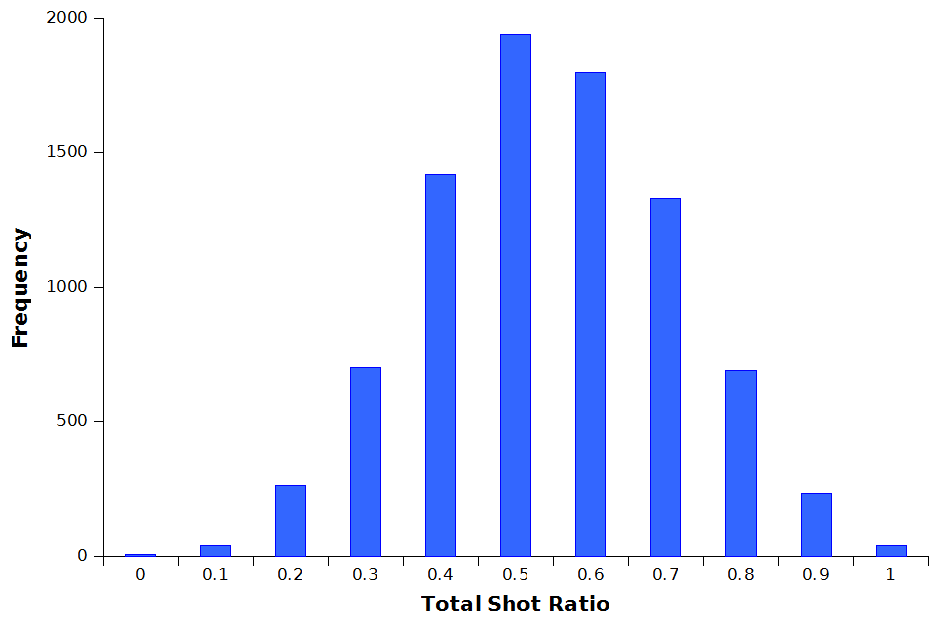 Figure 2: Distribution of Total Shot Ratios
The average Total Shot Ratio is always 0.5, because for every value above 0.5 you always an equivalent value below it for the opposition. For example, if the home team’s Total Shot Ratio is 0.75 then the away team’s ratio must be 0.25.
$(0.75 + 0.25) / 2 = 0.5$
The standard deviation, which is a measure of the dispersion of the data around the average value, was 0.166.
Total Shot Ratio: Correlation With Goals Scored
Since Total Shot Ratios are being used to show dominance in a match it makes sense to assess the correlation with the number of goals scored. The higher a team’s Total Shot Ratio is then the more shots it is having compared with the opposition so the expectation would be that they would score more goals. However, this does not seem to be the case as the relationship between the two is extremely weak (Figure 3; r2=0.079).
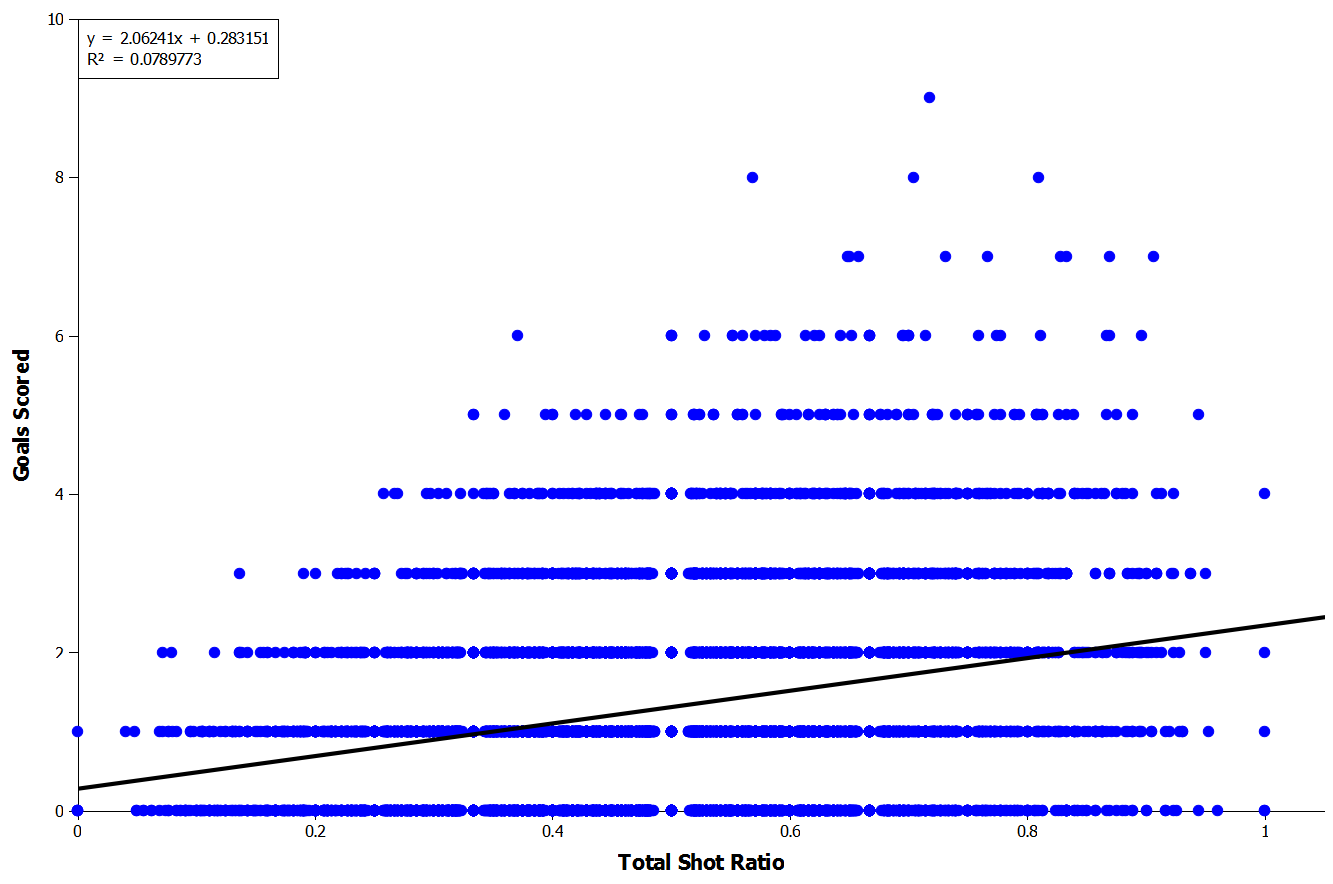 Figure 3: Correlation Between Total Shot Ratio and Goals Scored
Total Shot Ratio: Correlation With Goal Difference
So how about the relationship between Total Shot Ratio and goal difference instead? Since teams with higher Total Shot Ratios are thought to be dominating matches, perhaps they are more likely to have a higher goal difference in the match as they may also be less likely to concede goals? Again though the correlation is weak (Figure 4, r2=0.11).
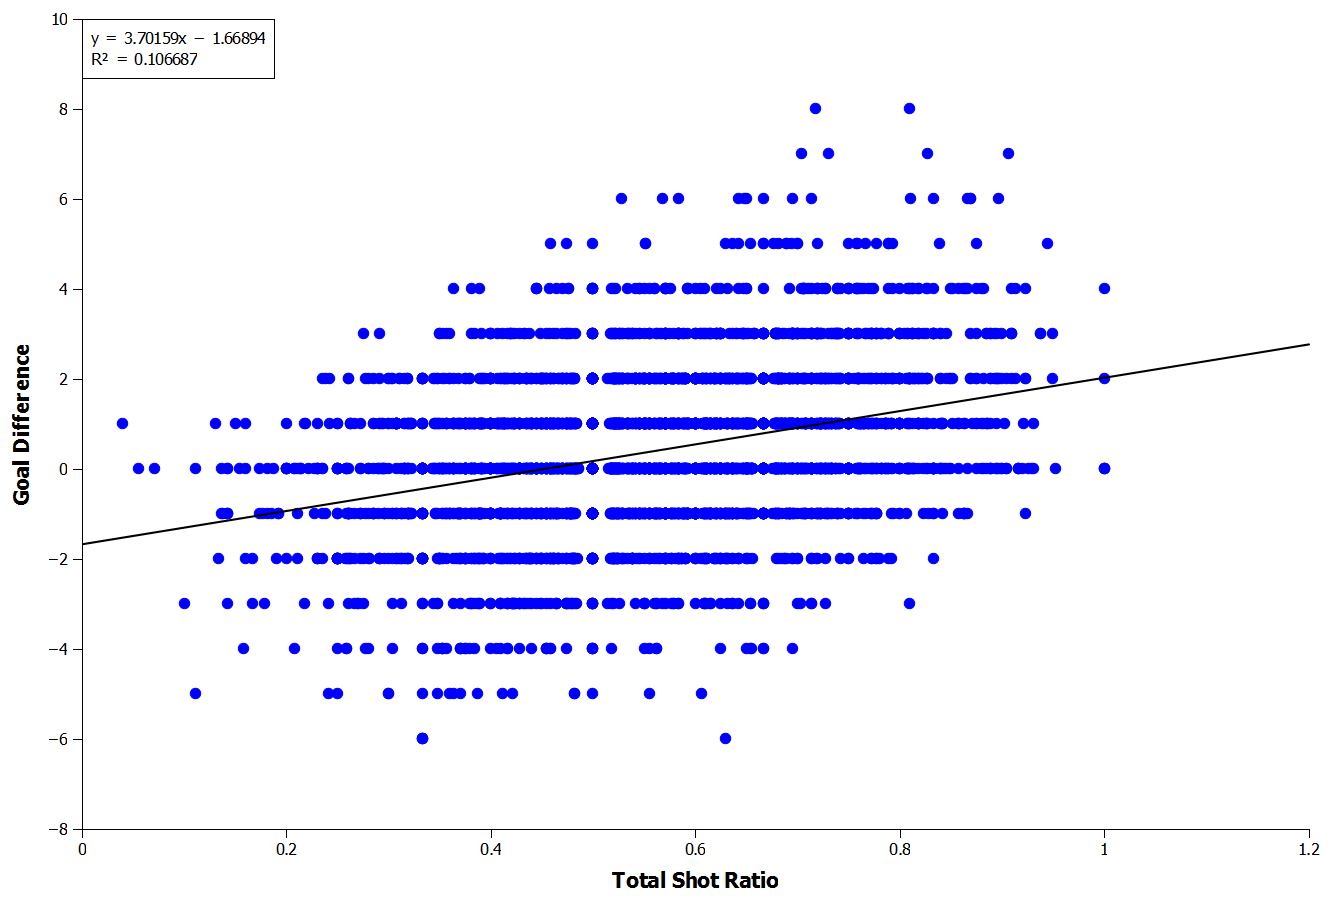 Figure 4: Correlation Between Total Shot Ratio and Goal Difference
Total Shot Ratio: Correlation With Match Outcomes
Additionally, the relationship between Total Shot Ratio and match outcome is also poor (r2=0.066) suggesting that Total Shot Ratio also has very little influence on the likelihood of a team winning a particular match. Just because you are taking a greater proportion of the shots does not mean you are any more likely to win.
Total Shot Ratio: Correlation With Points Per Season
Although the match-by-match correlations above are weak there is the suggestion of a trend so it may be that Total Shot Ratio is heavily luck driven in the short term and that we need more matches before we can see the overall effects of a higher ratio. For example, looking at the correlation between Total Shot Ratio and points over an entire season shows a pretty decent relationship between the two (Figure 5). This suggests that long term possessing a higher Total Shot Ratio is in fact associated with fewer matches being lost per season.
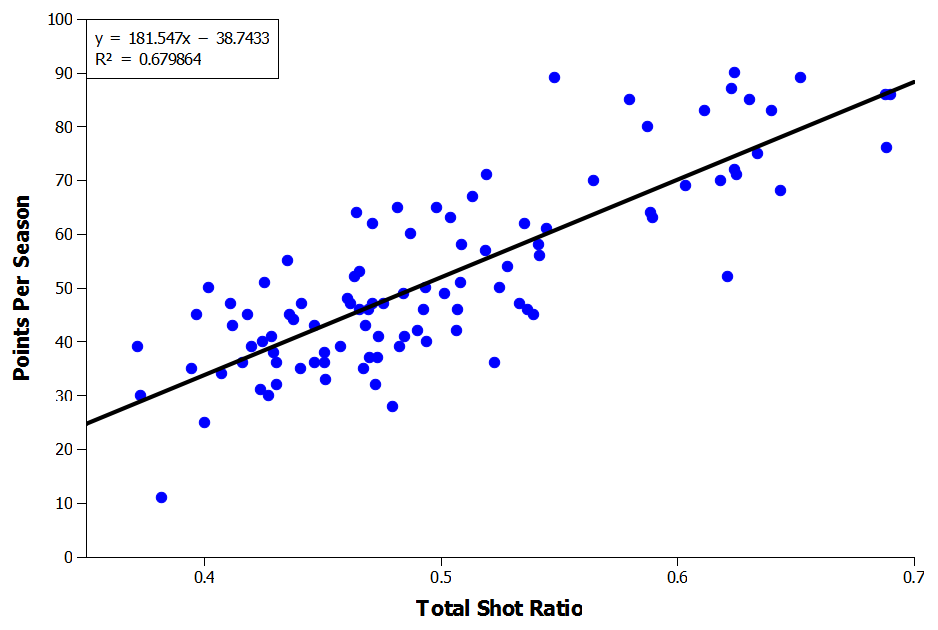 Figure 5: Correlation Between Total Shot Ratio and Points
Total Shot Ratio: How Much Data is Enough?
So if Total Shot Ratio is only becoming meaningful over longer periods of time then how much data do we actually need before it becomes a useful metric? To look at this I calculated the overall Total Shot Ratio per season by team and then randomized the order of each match that season. I then looked at how the deviation changed over course of a season compared with the overall ratio, e.g. after five matches, ten matches etc (Figure 6).
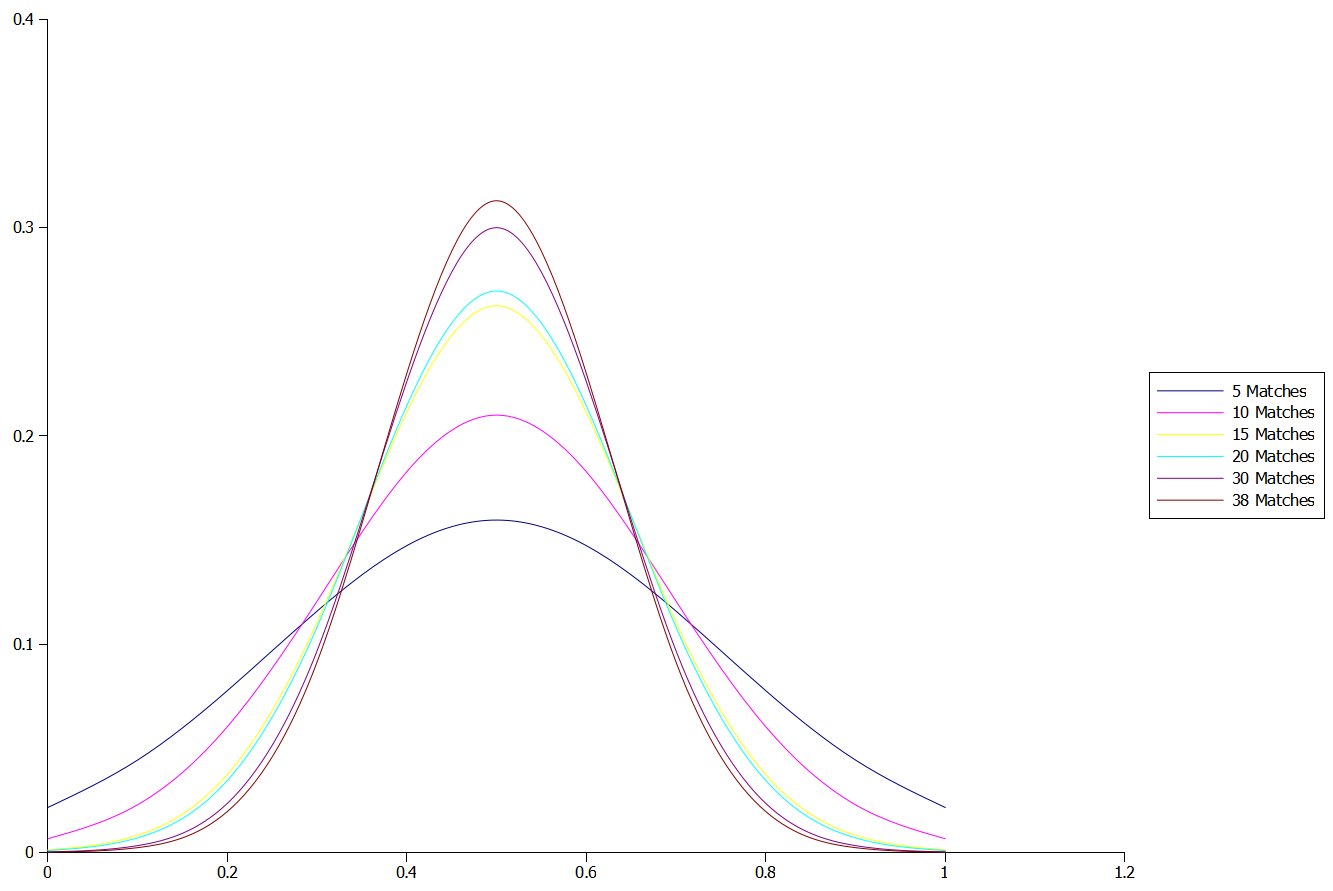 Figure 6: Deviation in Total Shot Ratio by Sample Size
As more data is used to calculate the Total Shot Ratio it moves closer towards its true value and the deviation decreases as the effect of any outlier matches becomes less influential. With fewer matches being used to calculate the Total Shot Ratio there is more dispersion and variability in the calculated value. Interestingly, there is still a reduction in the deviation moving from 30 matches to 38 matches, suggesting that we may need at least a full season’s worth of data to get an accurate measure of a team’s Total Shot Ratio.
Total Shot Ratio: Calculated Sample Size
Another option to find out how much data we need is to calculate the sample size required to identify specific differences in Total Shot Ratio. There are a number of different methods for this but the commonly used t-test sample size estimation suggests that to be 95% certain that two teams with a difference in Total Shot Ratio of 0.1 are actually different from each other takes 45 matches.
So, to be statistically certain that a team with a Total Shot Ratio of 0.6 actually has a higher ratio than a team with a Total Shot Ratio of 0.5 rather than it just being down to random variability requires over a season’s worth of matches to be played.
As the differences become smaller then the number of matches required increases even further – to identify a difference in Total Shot Ratio of 0.05 takes nearly five season’s worth of matches!
Conclusions
In the short term, Total Shot Ratio appears to virtually meaningless in terms of goals scored or match outcomes as its variability is so high.
Over the long term though, skill outweighs luck and Total Shot Ratio becomes increasingly correlated with outcomes. However, it may take a long time for this to occur and may be less accurate than other statistics available if you are interested in predicting performance.
Finally, this article is not intended to say “do not to use Total Shot Ratio” as it is still an interesting metric. Rather, make sure that you are aware of its abilities and limitations if you are planning on using it for analysis.