Introduction
Having found that the correlation between goals scored and shots on target was the strongest of the various shooting variables I had available to me, I decided to see how well they could predict the outcome of a football match.
Creating The Model
The obvious approach would have been to just do a linear regression for goals scored against number of shots on target and then predict the average number of goals each team would be expected to score. This doesn’t provide much insight though. The average score line might be of interest if each team was going to play each other 20 or 30 times a season but for a single game it is pretty much irrelevant.
What is of more use is to predict the actual odds for each possible outcome between the teams. In other words what is the probability of each team winning, drawing or losing?
To do this I looked at how many shots on target each team achieved and conceded each match compared with the league’s average to estimate how many they would be expected to have against each other. This was then mapped to the distribution of their shot on targets over the season so far and their shot conversion rate used to calculate the probabilities of the different number of goals they could score. Each match was then played one million times as part of a Monte Carlo simulation to see what the likely outcomes was.
Are the Predictions Accurate?
One difficulty with a model like this is to assess its accuracy. With a traditional linear model you can just look at the $r2$ value to see how well you predictions match the actual results. The higher the $r2$ value then the better your model is.
But with a probability model this doesn’t work. For example take the situation where the probability model predicts Team A have a 75% chance of beating Team B. Even if the model has calculated these odds perfectly then Team A will still lose 25% of the time, making it look like the prediction was incorrect.
One alternative is to identify what the most probable outcome for each match was – win, draw or loss – and compare that with what actually happened to see if they match. To do this I applied the model retrospectively to all the matches from the 2011–2012 English Premier League season and overall the proportions of outcomes predicted did match closely what actually happened (Figure 1).
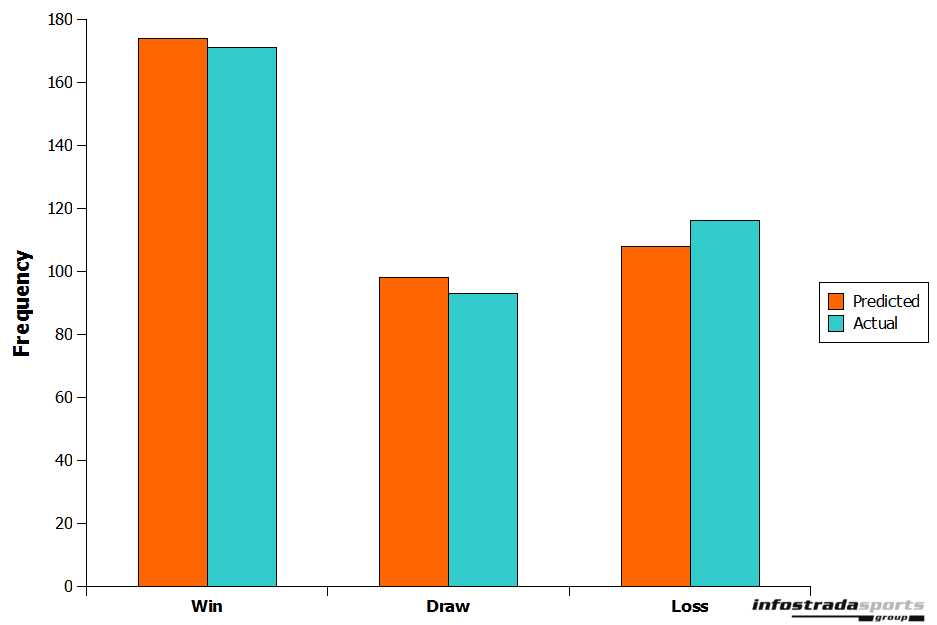
Figure 1: Proportion of outcomes predicted compared with actual results for 2011–2012 English Premier League season
Another test we can do is to compare the Shot on Target model with other models to see how well they compare. Again I picked the most probable outcome from my odds and this time compared it with those from Bet365 for the entire 2011–2012 English Premier League season. I also randomly guessed the outcome for each match by chance to see how the model compared with pure luck too.
Prediction Results
Overall, the Shot on Target model’s most probable outcome correctly matched what actually happened for 43% of the matches tested compared with 52% for Bet365 and 33% from randomly guessing.
Interestingly, even the bookies only managed to get the odds correct for around half the matches so the Shot on Target model is doing pretty well at 43% and isn’t that far behind the professional odds compilers. Also, this is only the first stage of the model, there are still plenty of ways it can be tweaked to try and improve its accuracy further.