Introduction
Previously on this blog I have discussed my attempts at using the Poisson distribution to predict the number of goals scored in football matches. So far, the results have been disappointing as the mathematical model I constructed under-predicted the number of draws that occurred. This is something I intend to go back and address at some point by adding in the Dixon and Coles adjustment but in the meantime I thought I would try predicting the outcome of matches using shots instead.
Shot Data
There were a number of reasons for working with shots instead of using goals directly. First of all, shots and goals are inherently linked together. For every goals scored there has to be a shot taken. Secondly, not every shot taken leads to a goal, giving us a much larger data set to work with compared with just goals alone. Thirdly, the number of shots taken in a match is pretty much normally distributed (Figure 1) whereas the number of goals scored is closer to a Poisson distribution. This is useful as many statistical tests rely on a normal distribution of data.
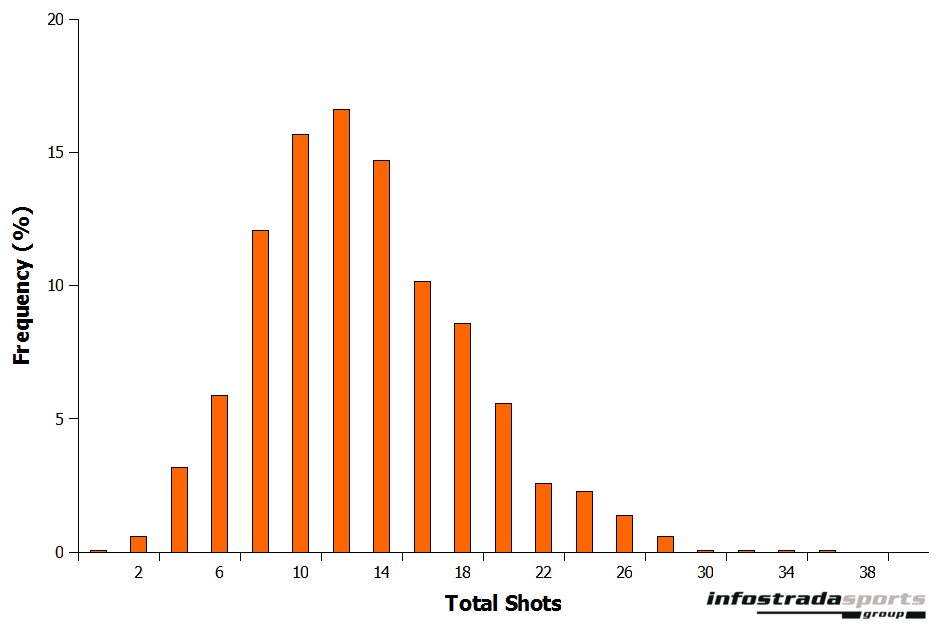
Figure 1: Frequency of total shots in English Premier League matches 2009–2012
The first stage of developing the model was to determine what variables to use for it. Looking at data over a whole season showed a decent correlation between goals scored and total shots taken ($r2$=0.62), shots on target($r2$=0.76), shots blocked ($r2$=0.59) and shots wide ($r2$=0.32; Figure 2).
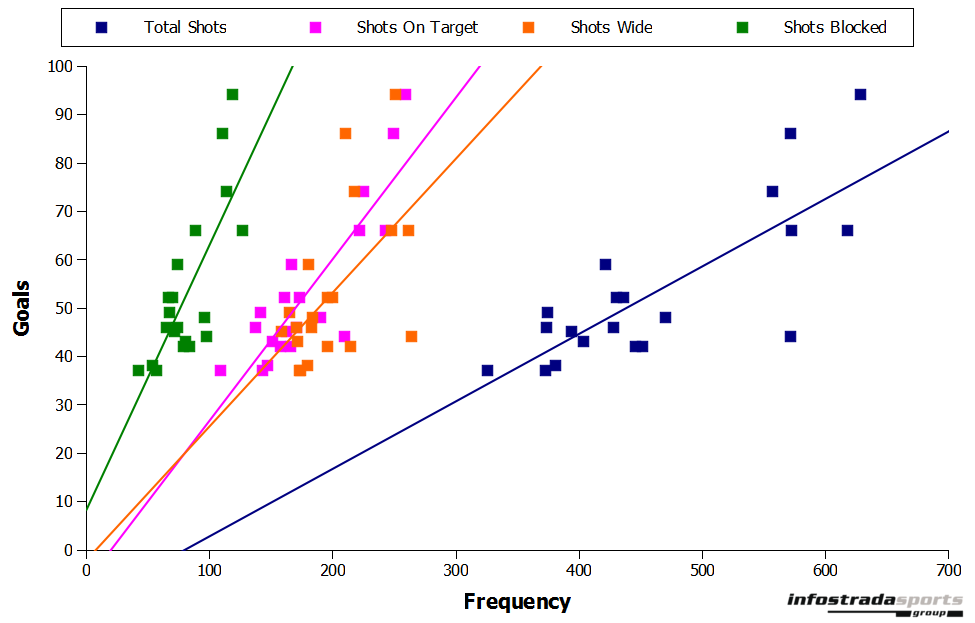
Figure 2: Correlation between goals scored and various shooting parameters for the 2011–2012 English Premier League Season
Variability
Unfortunately when you start looking at the data match-by-match the correlations become much weaker. Over the course of an entire season a lot of the variability in the data starts to even out but over a single match it is not the case and variables such as luck can play a much bigger role. For example it is likely that the teams with the most shots on target will score the most goals overall per season as skill would start to dominate over luck. However, this isn’t always the case for an individual game – we have all seen matches where a team has scored a lucky goal and then managed to hold on for the win even though the opposition has showered their goal with shots for ninety minutes.
Because of this I decided to exclude many of the variables as they have little value over a single match. Instead, I focussed on using just shots on target data as this had the highest correlation with goals match-by-match. As with the total number of shots taken, the data is also roughly normally distributed although it is skewed towards zero (Figure 3) as obviously no matter how bad a team is it cannot achieve less than zero shots on target in a match (although Blackburn Rovers come close by managing to go the entire match against Tottenham Hotspur in 2012 without taking even a single shot, let alone managing to get one on target!)
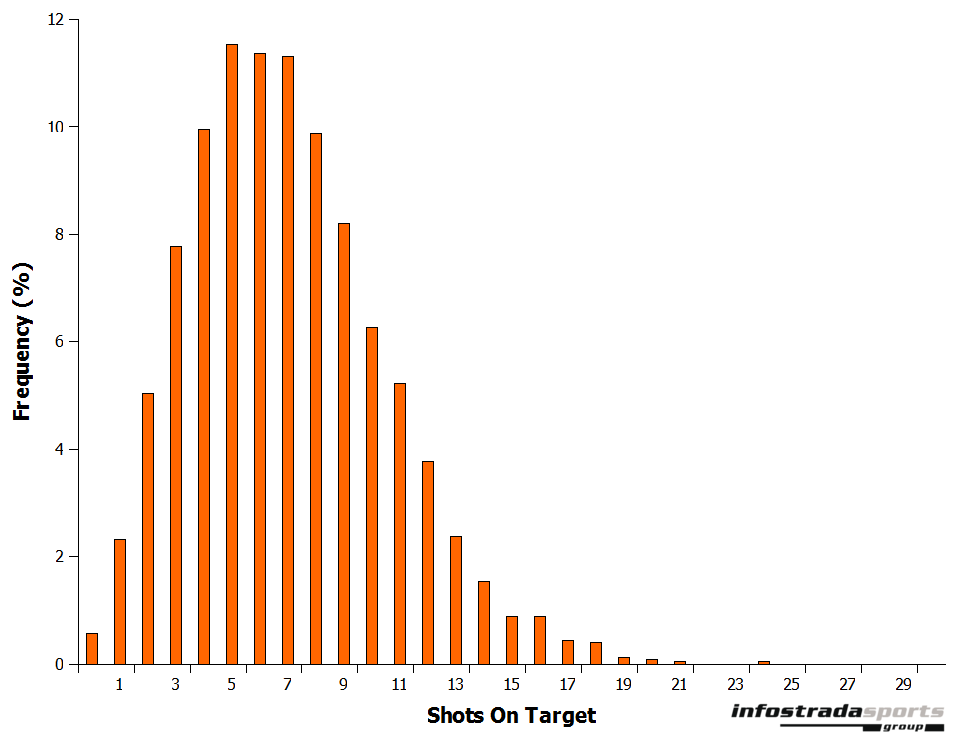
Figure 3: Frequency of Shots on Target in English Premier League matches 2011–2012
In my next post I will explain more about how the Shot on Target model works and discuss its accuracy.